
For when cleaner air in our cities?
Do you want to know what initiatives Madrid, Barcelona, Stockholm or Munich are carrying out against pollution? Or what is each city council doing to reduce 27% of the greenhouse gases that we emit in Europe? And when will the sale of diesel and gasoline cars end?
Greenpeace Spain in the framework of the European campaign Clean Air Now has created an interactive map where you can consult more than 200 actions that some cities and governments are doing to limit the pollution caused by motor traffic.
Clearly air pollution is one of the most harmful agents, not only for the planet but for our health.
According to study sources 'Every Breath a Treat' published by Greenpeace, NO2 causes 72,000 premature deaths each year and 9 out of 10 people breathe polluted air. In order of mortality (in 2016), Italy was the country with the most deaths , behind, the United Kingdom, Germany, France and Spain.
"We have compiled the existing data on several pages about traffic regulations focused on each of the countries, especially those of Germany and Italy, which are the ones that have the most measures in progress in this regard. The information provided by the offices that Greenpeace has throughout Europe has also been included, who have validated the data corresponding to their country before publication," says the coordinator of the mobility campaign of Greenpeace Spain , Adrian Fernandez.
This map aims to require European countries to comply with the Paris agreement to reduce global warming in 1.5ºC . They also demand that these types of vehicles stop being sold before 2028.
Some countries, such as Spain, have set 2040 as the deadline, while others such as Ireland, Denmark or the Netherlands will bring it forward to 2030.
A MAP TO END NO2
The cities that appear on the map are divided into 3 categories:
1. Urban Tolls: they are the cars that must pay a fee to enter the city, the proceeds of which are invested in improving public transport. This is the case of London or Stockholm , with tolls in force for more than a decade.
two. Low Emission Zones: These are areas where access is limited to vehicles that do not have a specific environmental label. They are already visible in Germany , with more than 70 zones since 2008. Belgium has also already launched several, and it is possible that in the coming months French cities such as Lille or Montpellier.
3. Restricted Traffic Areas: these areas limit access to all vehicles with exceptions, such as residents or deliveries, allowing comfortable and safe walking environments. Increasingly common in Italy , where most cities with historic centers have these areas, called ' ZTL’.
In Spain we can see that thanks to proposals such as Central Madrid emissions and pollution have decreased, and Barcelona plans to create a Low Emissions Zone soon . At the moment only these two would have low emission zones; yes they appear (in blue circle) the cities that have implanted restricted traffic areas , such as Pamplona, which has been there since 1980, Pontevedra, since 1999, Malaga, since 2009, and Granada since 2010.
Join this year Girona and Valencia , for instance. According to Greenpeace, "the absence of Seville stands out, which, despite having the 'Central Plan' system fully installed, has not been put back into operation after its suspension in 2011".
If we talk about urban tolls In Europe, more and more cities are joining this initiative, but few. We can see Milan, which has had tolls since 2012, Palermo with a rate of 5 euros per day and 2.5 euros for residents since 2016; and in northern Europe, in cities where it is already more established, such as Stockholm, Oslo, Gothenburg or Bergen , among other.
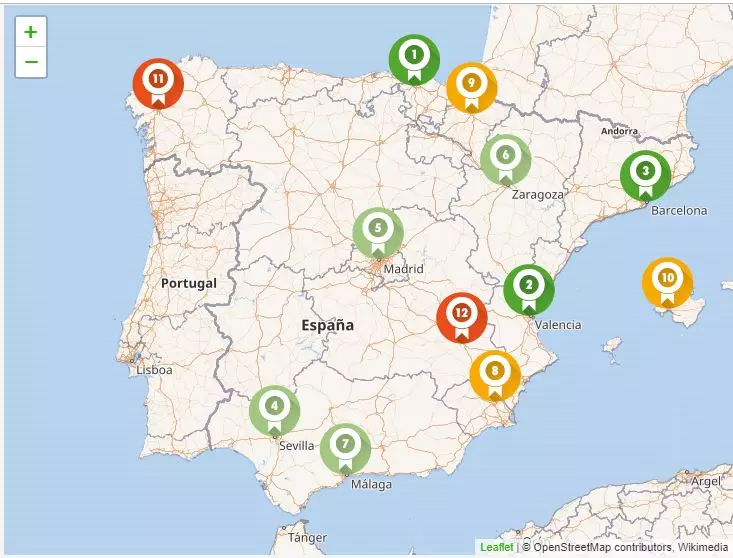
The sustainable mobility map.
SUSTAINABLE MOBILITY
To reduce pollution in cities must bet on sustainable mobility That is why Greenpeace has also shared a map with the cities in Spain where a commitment to sustainable mobility is being carried out. Bilbao, Valencia and Barcelona they have the highest scores with 6.9, 6.6 and 6.5.
In the case of Bilbao they point out: “ 64% of trips are made on foot , while car use is only 11%. Its Mobility Plan includes public participation and a gender perspective, with the immediate challenge of increasing cycling mobility, following the example of Vitoria and San Sebastián”.
While in Valencia they point out as the cause of the growth of 50% of trips on foot , a cycling network of more than 150 km. And from Barcelona they comment the following: “After several years of policies in favor of pedestrian mobility, a large cycling network and the new bus network, Barcelona is reducing the use of the car in favor of clean modes . Despite the good data, the levels of noise, pollution and accidents are still unacceptable. Barcelona needs to reduce the intensity and speed of traffic on its large avenues”.
It can also be checked how many Spanish cities suspend . The clearest examples are those of Albacete , in last place, with a 3.7, Santiago de Compostela with a 4.4 and Palm with a 4.6.
Why? Albacete, for example, despite having good conditions for the use of bicycles as it is an accessible city over short distances, most opt for the use of the vehicle to visit them ; in Santiago, they point out as the problem “the growing dispersion of the population towards the surrounding municipalities, causing an increase in car dependency (40%) and low use of public transport (12%)”.
Meanwhile in Palma de Mallorca, "The island's tourist pressure and the excessive rate of motorization harm the mobility figures, which nevertheless show an improvement, approaching the objective of its Mobility Plan".